Electronic vs Thermal Overload Relay: Accuracy, VFD Duty and High-Inertia Loads
Thermal relays model heat physically; electronic relays calculate it. Compare accuracy, VFD duty and high-inertia starts, and see where each type belongs.
Read More
A motor thermal damage curve and an overload relay trip curve are both drawn on the same log-log axes, and the entire protection argument reduces to one sentence: the relay curve must sit below the damage curve everywhere the motor can operate, and above the starting current for as long as acceleration takes. Everything else — trip class, thermal capacity, coordination with upstream devices — is detail that makes those two conditions true in a real panel.
This guide covers how to read both curves, how to plot them against each other, and the one trap that makes a correctly set relay look miscoordinated on paper. It assumes the relay is already chosen; the setting arithmetic is in overload relay field setting.
A motor datasheet gives you up to six usable points: running overload (hot and cold), locked rotor (hot and cold), and starting current at rated and reduced voltage. A relay datasheet gives you a trip curve for each class, at a stated preload. Put both on log-log axes with current in multiples of full-load current on the horizontal and time in seconds on the vertical, then check:
If all three hold, the protection is coordinated. If any fails, the fix is a different trip class or a different curve — not a dial adjustment, which moves the whole line sideways without changing its shape.
Both curves live on log-log axes, and both errors people make come from reading them linearly.
| Axis | Unit | What the spacing hides |
|---|---|---|
| Horizontal | Current, usually in multiples of FLC or of the relay setting | One grid division may be a 2× step, not a fixed number of amps |
| Vertical | Time to trip, seconds or minutes, log scale | A short vertical distance near the top can be hours |
| Region 1.1–3 × FLC | Overload | Curve shape here decides nuisance trips versus winding protection |
| Region 5–7 × FLC | Locked rotor / stall | Curve shape here decides whether a stalled motor survives |
The overload and locked-rotor regions are governed by different physics and often by different parts of the same relay model. A curve that fits beautifully in the overload region can sit above the locked-rotor limit, and vice versa. That is the single most common reason a “correctly set” relay still allows a stalled motor to be damaged.
The motor’s thermal limit is not one line. It splits into a running branch and a locked-rotor branch because the heat paths are different: a running motor cools through its own rotation and frame airflow, while a stalled motor has no internal airflow and heats far faster for the same current.
Each branch also comes in hot and cold versions, and this is where most plotting goes wrong. A hot curve is drawn from a stated initial current — the preload the motor was carrying before the event — and reputable manufacturers publish that value, because the curve is meaningless without it. A hot curve drawn from 1.0 × FLC and one drawn from 0.97 × FLC look similar but trip at noticeably different times just above the knee.
Practical consequence: when you compare a relay curve to a hot motor limit, confirm the preload the manufacturer used. When you compare it to a cold limit for a start from ambient, confirm the relay’s own preload assumption matches. Two curves drawn from different starting conditions will disagree even when both devices are behaving perfectly.
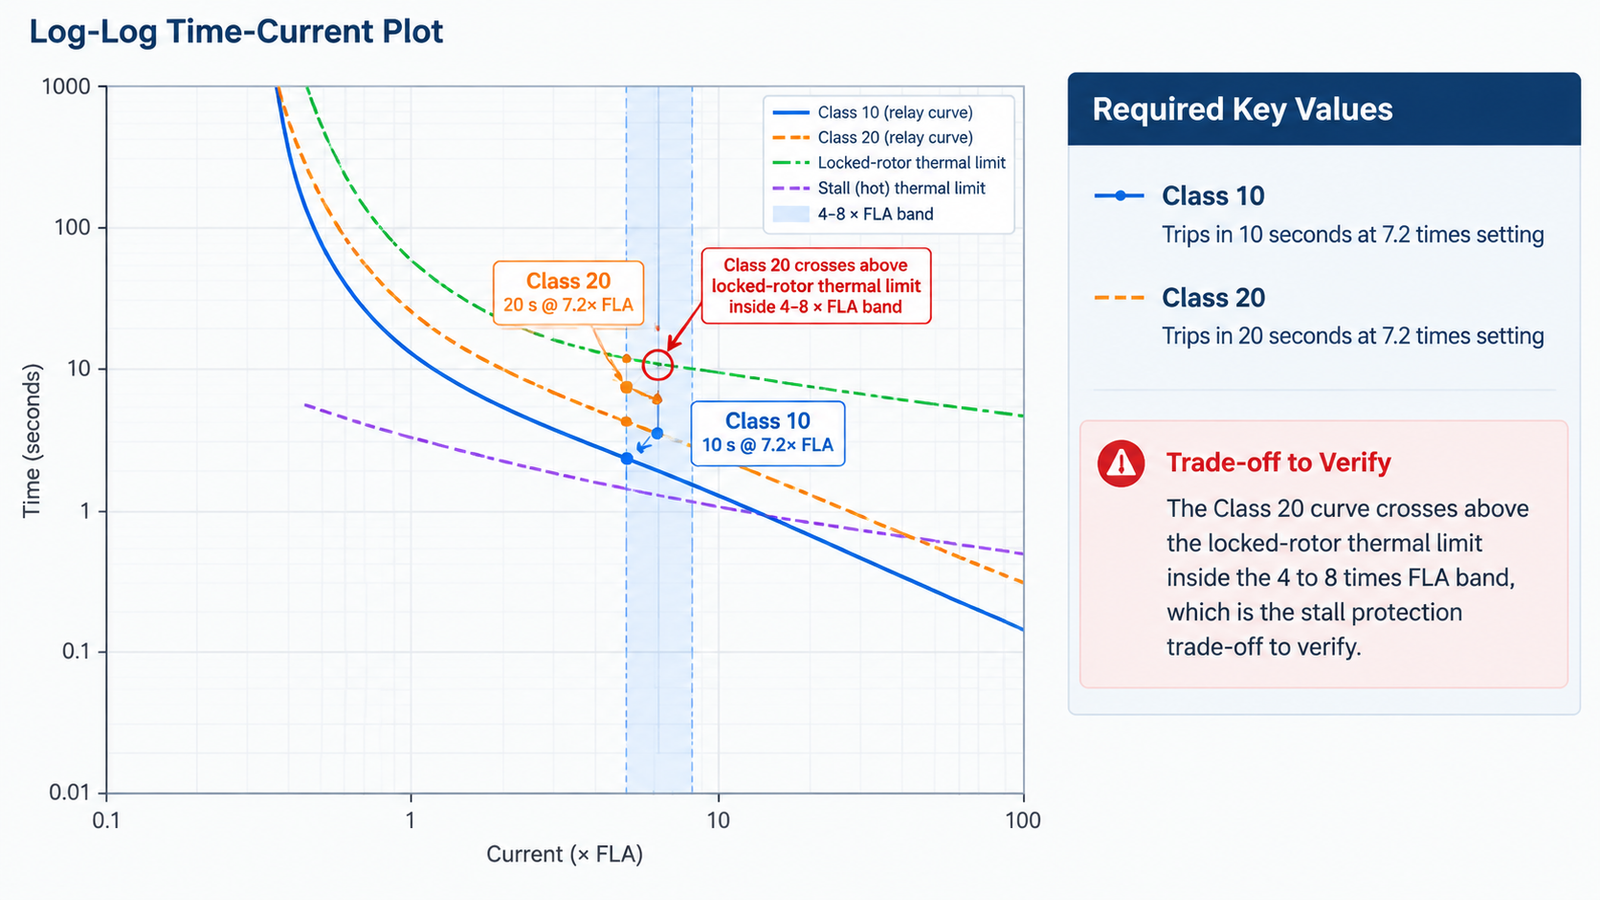
A 400 V, 15 kW conveyor motor with nameplate FLC 29 A, direct-on-line start, measured run-up 12 seconds at about 6 × FLC. The datasheet gives a hot running thermal limit and a cold locked-rotor limit. The relay is a Class 10 thermal unit.
| Point | Current | Time available or taken | Verdict against Class 10 |
|---|---|---|---|
| Normal running | 1.0 × FLC (29 A) | Continuous | No trip — correct |
| Moderate overload | 1.5 × FLC (43.5 A) | Thermal limit measured in minutes | Class 10 curve sits below the limit — coordinated |
| Heavy overload | 2.5 × FLC (72.5 A) | Thermal limit tens of seconds | Still coordinated, margin narrowing |
| Acceleration | ≈6 × FLC (174 A) | 12 s to reach speed | Not coordinated — Class 10 allows under 10 s at 7.2 × setting |
| Stalled rotor | 6 × FLC | Cold locked-rotor limit around 15–20 s | Class 10 trips in time — correct |
The plot shows the problem immediately: the same Class 10 curve that protects the stalled motor correctly trips a healthy 12-second start. Class 20 buys the acceleration margin — but note the price. At 6 × FLC a Class 20 relay can sit above a 15–20 second cold locked-rotor limit, so a genuine stall now takes longer to clear than the winding tolerates. Before committing to the higher class, re-check the stall region of the plot. If Class 20 no longer protects a stalled rotor, the fixes are a jam or stall protection element, or an electronic relay with separate run and start curves — not a return to Class 10, which fails the start, and not a higher dial, which fails everything. The dial stays at 29 A in every scenario: moving it right shifts the whole curve and puts the running overload region above the thermal limit.
The class-versus-dial distinction is covered in more depth in NEMA Class 20 vs IEC Class 10.
Put a motor thermal curve and an upstream breaker on the same coordination diagram and something odd happens: the breaker appears to operate faster than the thermal curve in the locked-rotor region, which reads as miscoordination. In most cases it is not, and understanding why saves a lot of pointless device changes.
The upstream breaker is a time-overcurrent device: for a given current it trips in a fixed time, whatever happened before. The thermal curve is a time-temperature-current characteristic: its trip time depends on how hot the stator already is. Two consequences follow.
The genuine risk case is a cold start that should succeed but takes longer than the upstream device allows. Three fixes are used in practice, in rough order of preference:
| Fix | How it works | Trade-off |
|---|---|---|
| Acceleration timer | Definite-time element that trips a failed start faster than the upstream device | Can misoperate on starts with unusually low voltage and long run-up |
| Phase time-overcurrent enabled during start | Set faster than the upstream device, slower than the motor’s acceleration, blocked once running | Needs a relay with start-state logic; more settings to document |
| Separate run and start curves | Setting groups switch curve on state change | Only available on electronic relays with setting groups |
What does not work is choosing a faster thermal curve to beat the upstream device. That fixes the plot and breaks the thermal model: the relay then calculates excessive thermal capacity during every normal acceleration, which produces false locked-rotor trips on the second or third consecutive start.
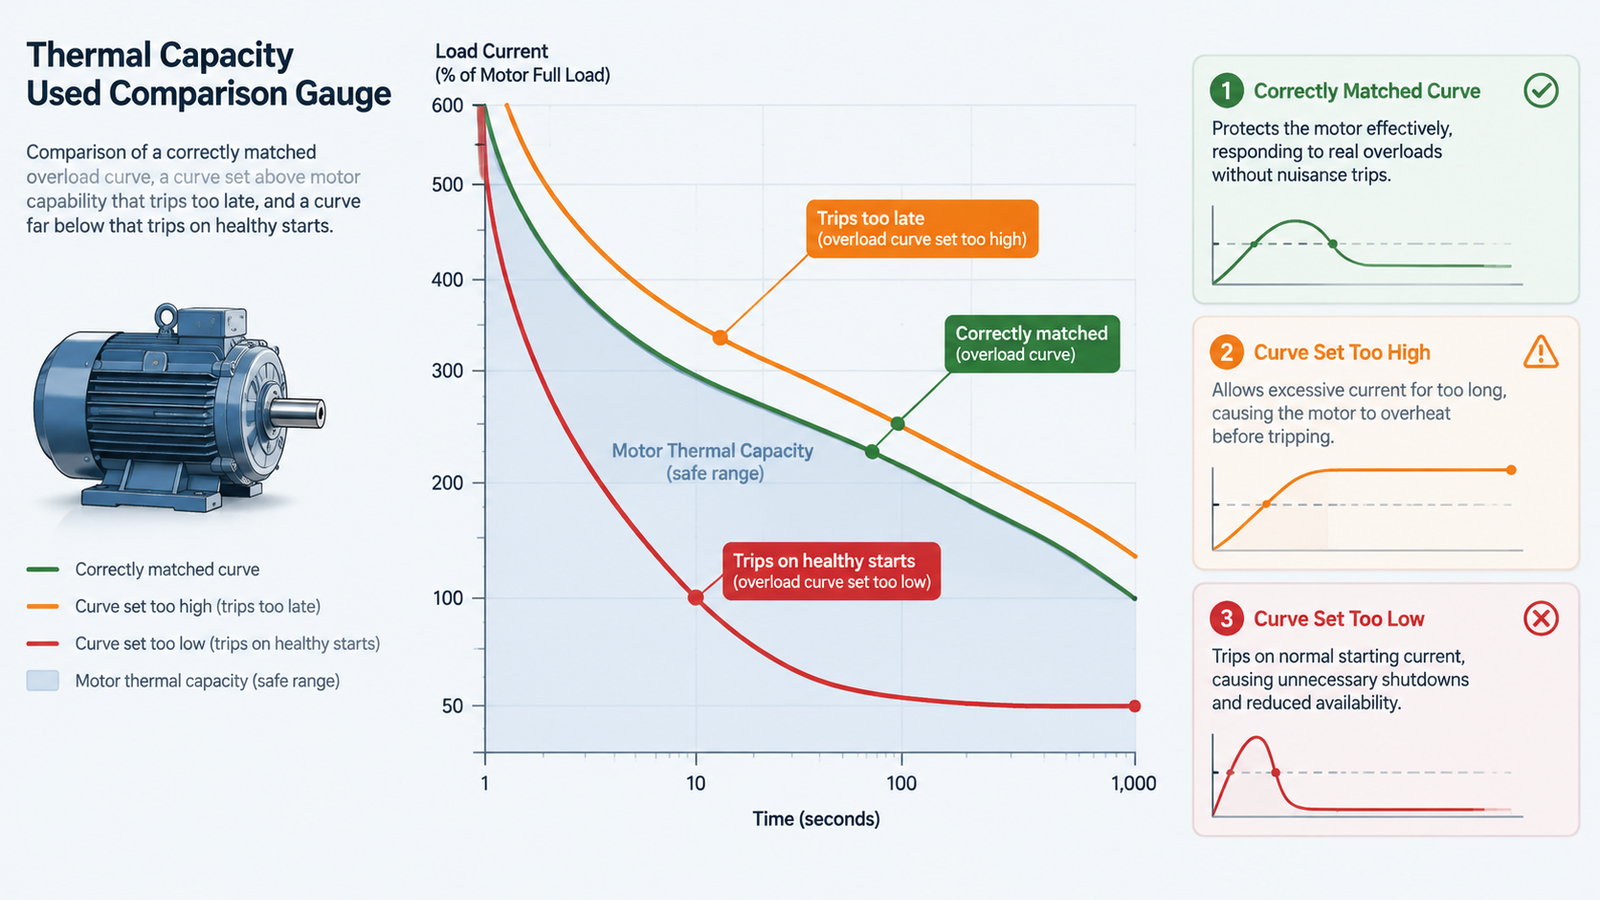
Electronic relays express the same information as a percentage of thermal capacity used, where 100% is defined by the selected overload curve. That definition is the whole point and the whole hazard: the curve is not an independent measurement of the motor, it is the model.
Winding RTD inputs can bias the model and correct it during steady-state operation, but they cannot fix a badly chosen curve during a transient, because the RTD lags the winding temperature exactly when the decision matters most. RTDs confirm the model; they do not replace it.
For the contactor that carries the current in this arrangement, the AC contactor range lists the AC-3 ratings that must survive the same start; a starter that is thermally coordinated but has an under-rated contactor simply moves the failure from the winding to the contacts. The CJX2-F series covers the mid-size frames typically used behind a Class 20 relay on conveyor and fan duty.
Plotting the two curves is a twenty-minute exercise that answers a question no dial position can: whether the relay protects the winding in every region the motor can reach. Six points, two lines, three conditions. The subtlety is not the arithmetic but the preload assumptions — a hot curve and a cold curve describe different motors, and the same relay can look correct against one and wrong against the other.
A plot of the current a motor can carry for a given time before its insulation is damaged, usually shown as separate running and locked-rotor branches, each in hot and cold versions. The relay’s trip curve must stay below it across the whole operating range.
Because trip time depends on starting temperature. A motor already at operating temperature reaches its limit faster than one starting from ambient. The hot curve is plotted from a stated preload current, and that value must be checked before comparing curves.
Because the thermal curve is time-temperature-current and the breaker is time-overcurrent. For a running motor the real thermal curve sits below the plotted one, so no miscoordination exists. The apparent problem is only real for a cold start with a stalled rotor.
No. A faster curve makes the relay over-estimate thermal capacity during every normal start, which causes false locked-rotor trips. Use an acceleration timer or a start-state overcurrent element instead.
It means the motor has reached the limit defined by the relay’s selected overload curve — not an independent temperature measurement. If the curve is above the motor’s real capability, 100% is reached too late.
They can correct steady-state operation, but not transients, because the RTD responds more slowly than the winding. Use RTDs to confirm the model, and choose the curve correctly in the first place.